Yes that's a fairly big generalisation but please allow me to do so...
This is the update which includes the next year, I need to find a good moment to do so because they have different book years and being US-based or European also means different publication dates for the same results.
Anyway, I took revenue and operating profit (also known as operating income, earnings from operations, income from operations, income before income taxes), and here are the absolute figures for "GMA":
Amazing how each of the Big Three managed to increase revenue as well as profit - and growth is double-digit too for each in all. Crisis? If there is any, it certainly doesn't affect these or they have taken extremely effective measures.
Or have they cheated by moving part of their R&D budget into profit? No. Google has slapped on an extra 30%+, Microsoft is back at the 2009 level and even Apple has increased its relatively tiny R&D budget. R&D spend as a relative part of revenue has increased for all, and only Apple was so unfortunate to see its R&D decrease as relative part of profit - because their profit almost doubled...
So, great news there: the crisis must be over! That must be why my council tax is increasing by 6%, my insurance by 10%, etcetera (...)
Now, let's have a look at my other friends
Again, increase after increase, revenue as well as profit. Even increase in profit as a percentage of revenue, although SAP doesn't play along there. But, a refresh course: where exactly does the money come from for these companies?
- Google sells digital billboards: in 2010, 97% of their revenue came from advertisements
- Microsoft sells software: in 2011, roughly 78% of their revenue came from software (slightly less than in 2010)
- Apple sells "hardsoftware": in 2011, 29% of their revenue came from hardware, and 62% from iPhone and iPad
- Oracle sells software: in 2011, 68% of their revenue came from software, 19% from hardware and 13% rest from services - hardware is growing fast at the expense of the other two
- SAP sells software: in 2010, 76% of their revenue came from software, the rest from services
- IBM sells services: in 2010, 57% of their revenue came from services, 22% from software and 17% from hardware
- HP sells everything: in 2010, 27% of their revenue came from services, 20% from printers, 15% from server hardware, and 32% from client hardware
So of all the above, only Oracle is changing tactics; and they are the only one to have growth all over, so maybe that is a result of that? And what growth: 30% and up!
Last but not least: my criticised approach of taking per-employee numbers. I do find this a really helpful comparison metric, after all it will make matters a lot more relative. Increasing absolute revenue and profit is fine, but what if you used twice as many employees to do so? Exactly
A 1-3% increase for GOOG, 10% for MSFT and a 35% one for AAPL. The fanbois should get worried now, even developing countries don't grow this hard - and fanbois are paying for this growth for sure. oh well, none of my business, I'm a happy Windroid user
The R&D spend per employee is ridiculously low for Apple in this comparison, as was the absolute one already. But you can see that per-employee, nothing changes.
Wondering about what Google spends their money on? I am for sure, but don't forget 40% of headcount is in R&D
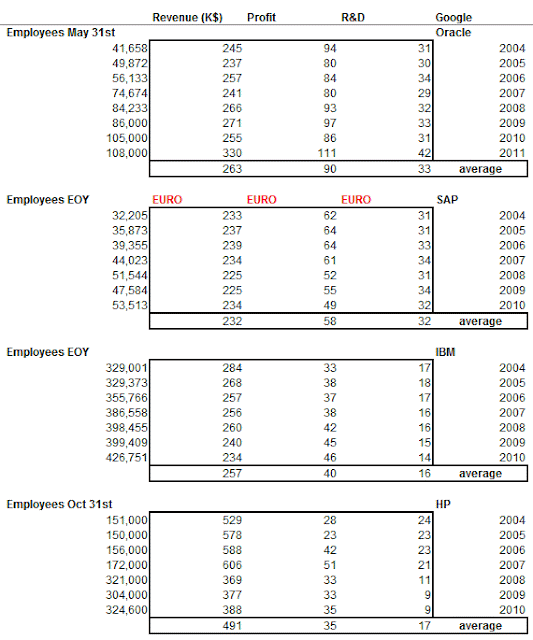
The relative stats for my other friends are here:
Now the type of growth is revealed: Oracle hardly increases headcount but slamdunks revenue and profit rise here - wow. Something really good going on there!
SAP is having issues. Personnel-wise they bit a bullet last year, and now are back to growth (4,233 growth alone is from acquisitions) but their per-employee profit is sinking over the years. APJ (Asia-Pacific-Japan) or India population percentage still remains at 22%, so there's something going on. Marketing and Sales grew 15%, administration 17%, being 1,989 people that aren't billable and mostly produce revenue that has got to be delivered by others. Then again Marketing and Sales people probably came very cheap in 2010...
IBM suffers from a decreasing revenue yet manages to stabilise profit, and the headcount just keeps growing. If you look over the years, they have done an incredibly consistent job upping the per-caput profit while revenue soared. Take that as an example, SAP
HP is doing fine. With the enormous acquisition and the crisis, they just haven't given in at all - although it looks like they're using R&D to boost the profit? Hard to tell really, their model has halved across the bar after they took over EDS, but ever since it's up-up-up!
What do I see? No crisis impact anywhere, that's for sure.
A nice and steady Google, a strong Microsoft, and an incredibly aggressive Apple. Yes their R&D is relatively was down but they have 5 times as much as in 2004...
Looking at the next 4, Oracle clearly wins. Steady growth all over, no crisis dip, double digits - impressive. SAP is struggling, but while they focus to maintain revenue they miss the fact that profit per employee is down 20% from what is was in 2004.
IBM has, since 2004, seen their per-employee revenue drop by 20% yet managed to increase profit by 40% - that is huge.
HP took a severe blow from EDS but has kept a sturdy pace ever since, not impressed by the crisis
And again, these four companies are sorted on revenue and profitability per employee. Surprisingly so, they are also ordered on R&D per employee


0 reacties:
Post a Comment
Thank you for sharing your thoughts! Copy your comment before signing in...